CONGESTION PRICING DATA DASHBOARD:
C2SMARTER Multimodal Density Tracker
This visualization draws from approximately 400 of New York City’s 900+ public traffic cameras located within and around the congestion pricing zone. Using vast snapshots captured every 30 minutes, we apply advanced computer vision techniques to estimate multimodal traffic density—including passenger vehicles, trucks, pedestrians, and bicycles.
Average traffic density refers to the average number of road users visible in individual camera snapshots over a defined period (e.g., weekly), offering a consistent measure of how crowded a road segment appears at different times. Additional information on methodology is included below.
Comparing January 2025 to January 2024 shows the following:
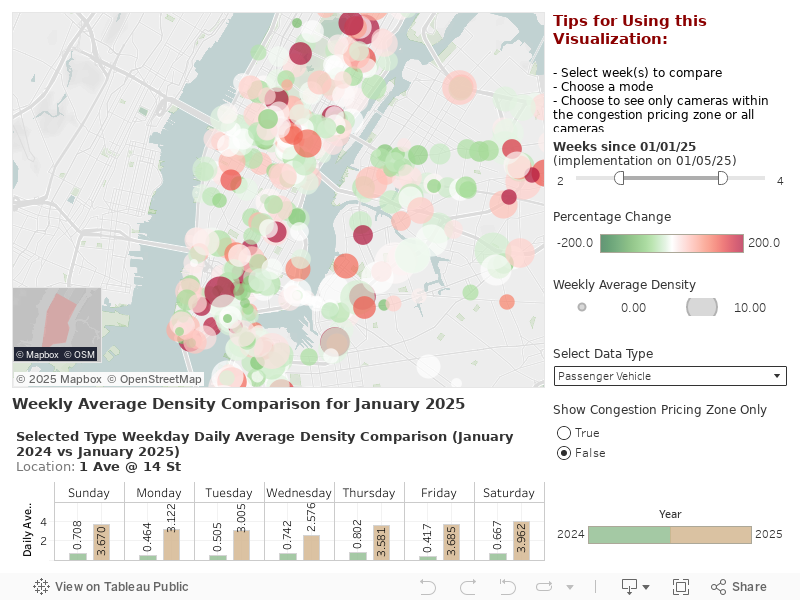
- Passenger vehicles. A decrease in average density (-5.4%) within the zone on weekdays. There was some increase in the buffer zone (+2.7%), but less than that of the decrease within the zone.
- Trucks. A noticeable decrease (-16.6%) within the zone on weekdays. Density decreases were observed on all crossing connected to the zone. Cameras surrounding the George Washington Bridge and the Cross Island Expressway at the Throgs Neck Bridge both saw density increases, which could indicate the redistribution and rerouting of truck traffic.
- Pedestrians. A slight increase within the zone on weekdays (4.1%) and weekends (6.6%). Cameras in tourist/commercial locations (Times Square, SoHo, Grand Central, etc.) showed the highest densities, which is also likely related to ongoing economic rebounds.
- Bicycles. An increase (10.3%) within the zone on weekdays. This is notable especially due to the colder and snowier weather in 2025 versus 2024.