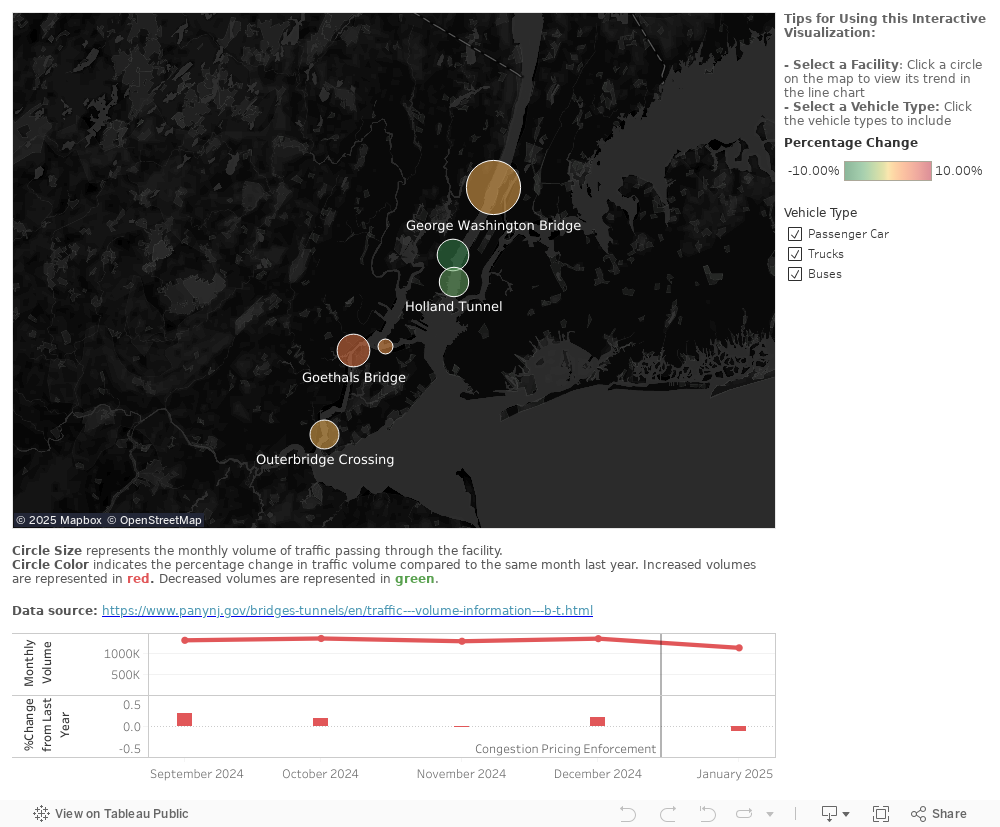
This visualization depicts weekly vehicle traffic crossing Port Authority of New York & New Jersey (PANYNJ) bridges and tunnels by plaza location. It includes both absolute weekly volumes and year-over-year changes.
In January 2025, the Holland Tunnel and Lincoln Tunnel experienced a decline in total vehicle volume compared to January 2024, with decreases of approximately 5% and 8%, respectively.