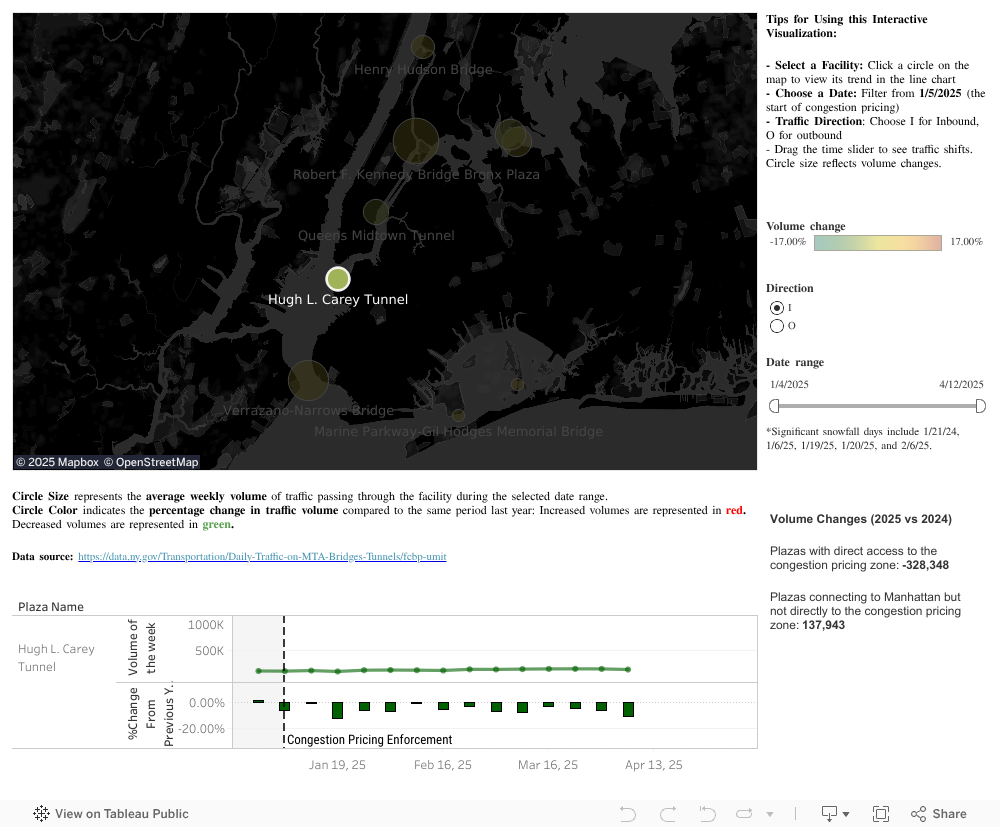
This visualization depicts weekly vehicle traffic crossing MTA bridges and tunnels by plaza location. It includes both absolute weekly volumes and year-over-year changes.
Considering data from January and February 2025 (compared to the same months in 2024), a reduction in inbound Manhattan traffic was observed at the two plazas directly connecting to the congestion pricing zone (the Hugh Carey and Queens-Midtown tunnels).