C2SMART Mobility Data Dashboard MATSim-NYC Integration
An all-in-one data dashboard was built with interactive analytics and visualization of various mobility data sources. The mobility board presents multi-data views in terms of vehicular traffic volume, corridor travel time, transit ridership, freight traffic by gross vehicle weight (GVW), and risk indicators like reported crashes, pedestrian and cyclist fatalities, and speeding tickets. The dashboard supports scenario analyses with these metrics in timeseries or comparisons to understand the temporal and spatial aspects of the data. This platform is updated regularly and continues to evolve with the addition of new data, metrics, and visualizations.Using multi-agent simulation to understand impacts of COVID-19 and mobility in post-pandemic economic reopening
A multi-agent simulation test bed for evaluating emerging transportation technologies and policies
C2SMART developed a multi-agent simulation test bed, dubbed MATSim-NYC, which is intended to be the first of a “Network of Living Labs” virtual test beds for evaluating emerging transportation technologies and policies. Unlike those primary transportation planning tools, MATSim-NYC and the rest of the Network of Living Labs is developed with the intent to be a quick-response benchmarking tool for different emerging technologies or policies. If a public agency wanted to test certain transit alignments, different congestion pricing schemes, service regions for different mobility options, this tool can provide some consistent assessment of its impact on the city. The key strengths of this tool is the combination of dynamic traffic and heterogeneous activity scheduling behavior of the population through a multi-agent simulation. This means that the tool can capture the trade-offs between traffic congestion by time of day with the route and departure time decisions of its varied travelers at a citywide level.
MATSim-NYC-COVID
A recalibrated simulation model designed for evaluating impacts of COVID-19 and policies for post-pandemic economic reopening
As part of the MATSim-NYC development, we calibrated a behavioral model (estimated as a tour-based nested logit model) for choosing different modes of transportation in NYC, which was encoded into the MATSim-NYC simulation as utility function parameters. Using the COVID mobility data, we recalibrated the behavior model to reflect the increased aversion to use shared use modes like public transit.
The work from home (WFH) population was identified using study data from Dingel and Neiman (2020) , and with New York State reopening phase plan, the synthetic population in MATSim-NYC was adjusted to fit the WFH proportions under COVID using random selections. The mode choice utility parameters were then adjusted to make the resulting non-WFH mobility patterns fit the observed data. The updated parameters imply that there would be greater preference to drive, walk, and bike, and less preference for transit, and to less extent, taxi, FHVs, and Citi Bike. We had two different population segments, which indicates same trends but different impacts on Manhattan and non-Manhattan travelers.
Validation of the model using transit station turnstile data shows for an 15% sample of station ridership data, there is only an average difference of 20% in the MATSim-NYC-COVID model in predicting station-level trips. These results are acceptable for citywide planning models in practice.
Pre-COVID
COVID-19
Impact of COVID-19 behavioral inertia on reopening strategies for NYC transit
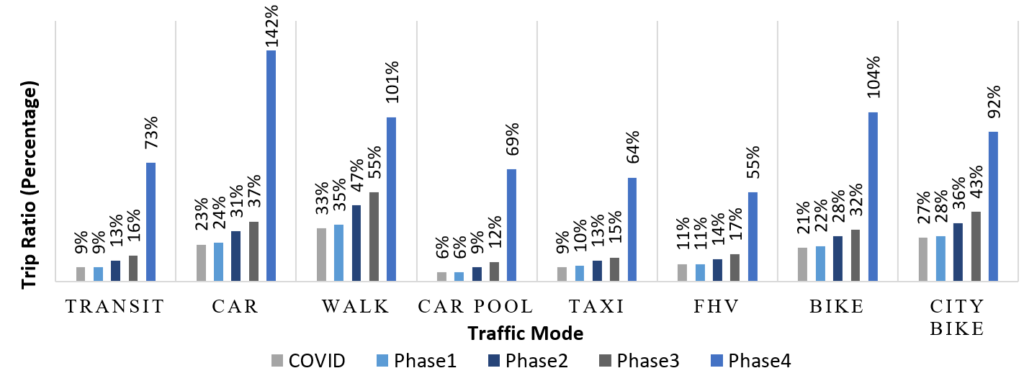
First, we analyze the reopening phases under behavioral inertia without transit capacity reduction to see how road traffic and transit trips would vary. This is seen in Scenario 1 in Figure 1, where CB is Citi Bike, and Ride is for carpooling. These values represent the total number of daily trips produced per mode under COVID and each of the phases of reopening, divided by the total daily trips during pre-COVID. Even by Phase 4 and without transit capacity restrictions, we can see that transit ridership may only return to 73% of pre-COVID levels while passenger car trips may exceed 142% of those levels. This demonstrates the amount of amplification to post-reopen traffic if there is travel behavioral inertia.
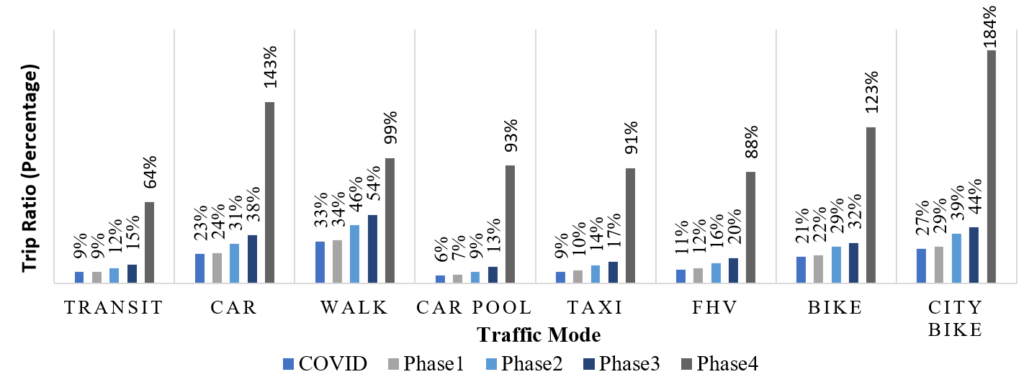
Then to look at Scenario 2, which sets a transit capacity restriction to 50%. The overall transit ridership under Phase 4 may go down further to 64% of pre-COVID level, but car trips may not go up much further (from 142% to 143%). The capacity restriction appears to be supported by shifts in passengers to non-car modes, particularly micromobility options like Citi Bike that may go up from 0.92 to 1.84 times pre-COVID levels.


Figure 1. The trip ratio in the COVID model and reopen phases in two scenario sets compared to the Pre-COVID model
This result show transit capacity restriction may not add significantly to car traffic (which is a primary concern) relative to what behavioral inertia is already adding. At the same time, micromobility gains significantly, which suggests a need to invest in supply for those options in NYC to accommodate the demand.
The model can help evaluate ongoing policies and operational strategies deployed by the city. The outcome of this model can also help monitor the degree to which people revert back over time (pre- and post-vaccine) to pre-COVID behavior, and the self-enforcement of social distancing on transit.
Ongoing work
The tool is now being used in collaboration with researchers at CTECH/Cornell to study the trade-offs between COVID exposure and environmental impacts under different reopening strategies.
We use the model to analyze mobility in post-pandemic economic reopening under social distancing guidelines. The social distancing requirement, with the aim of reducing contact risk in public transit, could exacerbate traffic congestion and emissions. We evaluate the trade-offs between traffic congestion, emissions, and policies impacting travel behavior to mitigate the spread of COVID-19 including social distancing and telework.
Publications
- The impacts of COVID-19 and reopening strategies can be found in our first COVID paper accepted to International Journal of Transportation Science and Technology. Access here.
- The fabric of the city is captured by a synthetic population, which the details of its development can be found in the paper published in Transportation Research Part A. Access here.
- The calibration and validation process for MATSim-NYC can be found in the paper published in Transport Policy. Access here.
